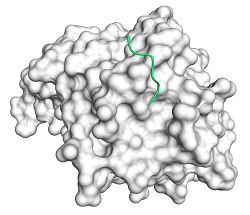
PepSet
A benchmark consisting of 185 protein-peptide complexes with peptide length ranging from 5 to 20 residues.
Evaluation metrics
The quality of a predicted protein-peptide model was measured by its RMSD of the ligand in the interface (IL_RMSD) and fnat. IL_RMSD was calculated based on the backbone atoms of the peptide residues within 10 Å from the protein after the optimal superimposition of the protein residues within 10 Å from the peptide. The RMSD calculation was executed using the ProFit program.34 Additionally, in order to further assess the side-chain quality, fnat ,the fraction of native contacts between the protein and peptide, is also employed for the assessment. Two residues in the protein and peptide are defined as a contact if any of their heavy atoms are within 4 Å. The criteria for assessment are summarized as follows:
-
Near-native prediction: IL_RMSD ≤ 4 Å and fnat ≥ 0.2 (peptide length ≤ 10), IL_RMSD ≤ 5 Å and fnat ≥ 0.2 (peptide length > 10)
-
Medium-quality prediction:IL_RMSD ≤ 3 Å and fnat ≥ 0.5
-
High-quality prediction: IL_RMSD ≤ 2 Å and fnat ≥ 0.8
Thus, the success rate, defined as the percentage of the cases with at least one near-native prediction within the top N models, was utilized to assess the performance of docking programs. For example, if the near-native conformations for 74 complexes out of 185 complexes can be found in the top 100 predictions, the success rate at the top 100 level is 74/185 = 40%.
Results

Figure 1. The success rates of global (A-C) and local (D-F) docking programs in the top N predictions for the entire dataset.

Figure 2. The success rates of global (A-C) and local (D-F) docking programs in the top N predictions for the easy, medium and difficult subsets.

Figure 3. The success rates of global (A-C) and local (D-F) docking programs in the top N predictions for the different peptide length subsets. (A, D) The results of MDockPeP_SA and MDockPeP_HA on the 11-15 subset are identical and thus both of them are colored red.
Results without NMR structures

Figure 1. The success rates of global (A-C) and local (D-F) docking programs in the top N predictions for the entire dataset without NMR structures.

Figure 2. The success rates of global (A-C) and local (D-F) docking programs in the top N predictions for the easy, medium and difficult subsets without NMR structures.

Figure 3. The success rates of global (A-C) and local (D-F) docking programs in the top N predictions for the different peptide length subsets without NMR structures. (A, D) The results of MDockPeP_SA and MDockPeP_HA on the 11-15 subset are identical and thus both of them are colored red.